Introduction
Contents
Introduction#
Explainable AI#
Complex supervised ML models are often considered to be “Black Boxes” because it can be hard to understand why certain predictions have been made by the model. It means that although the model correctly predicts the outcome of an observation, we cannot explain the logic behind those predictions. But why aren’t we just satisfied with an accurately predicting model?
“The problem is that a single metric, such as classification accuracy, is an incomplete description of most real-world tasks.” — (Doshi-Velez et al., 2017)
Nowadays, it is more and more important to not just accurately predict the outcome of a system we are trying to model but also to learn the underlying patterns in our data, in order to uncover the mechanisms behind those systems. Interpretability means, for example, to understand which features play the most important role in predicting the outcome of an observation or which combination of features lead to a certain outcome.
Forest-Guided Clustering#
Explainability methods like variable importance pinpoint the individual contribution of each feature to the classification or regression problem, but cannot identify the role of correlated features or of feature combinations.
Consider for instance a dataset where gender, alcohol and tobacco consumption are predictors for a specific disease. In this dummy dataset, alcohol consumption is a high risk factor for woman, while for men alcohol consumption is not a risk factor, but instead tobacco consumption is. In this case the feature importance of alcohol and tobacco consumption differs for different subsets in the data (men and women). This, however, cannot be uncovered by standard feature importance metrics that asign a single importance score to each feature. Forest-Guided Clustering allows to uncover such kinds of pattern by grouping the data into subgroups that follow similar decision rules in the trained Random Forest model.
Briefly, the algorithm computes a similarity metric between data points based on the Random Forest proximity matrix that indicates, which data instances follow the same decision path in the model. The computed similarity matrix is used as input for a k-medioids clustering, to find subgroups within the dataset. For each of these subgroups, following similar decision paths in the Random Forest, the importance of the different features can be analysed separately.
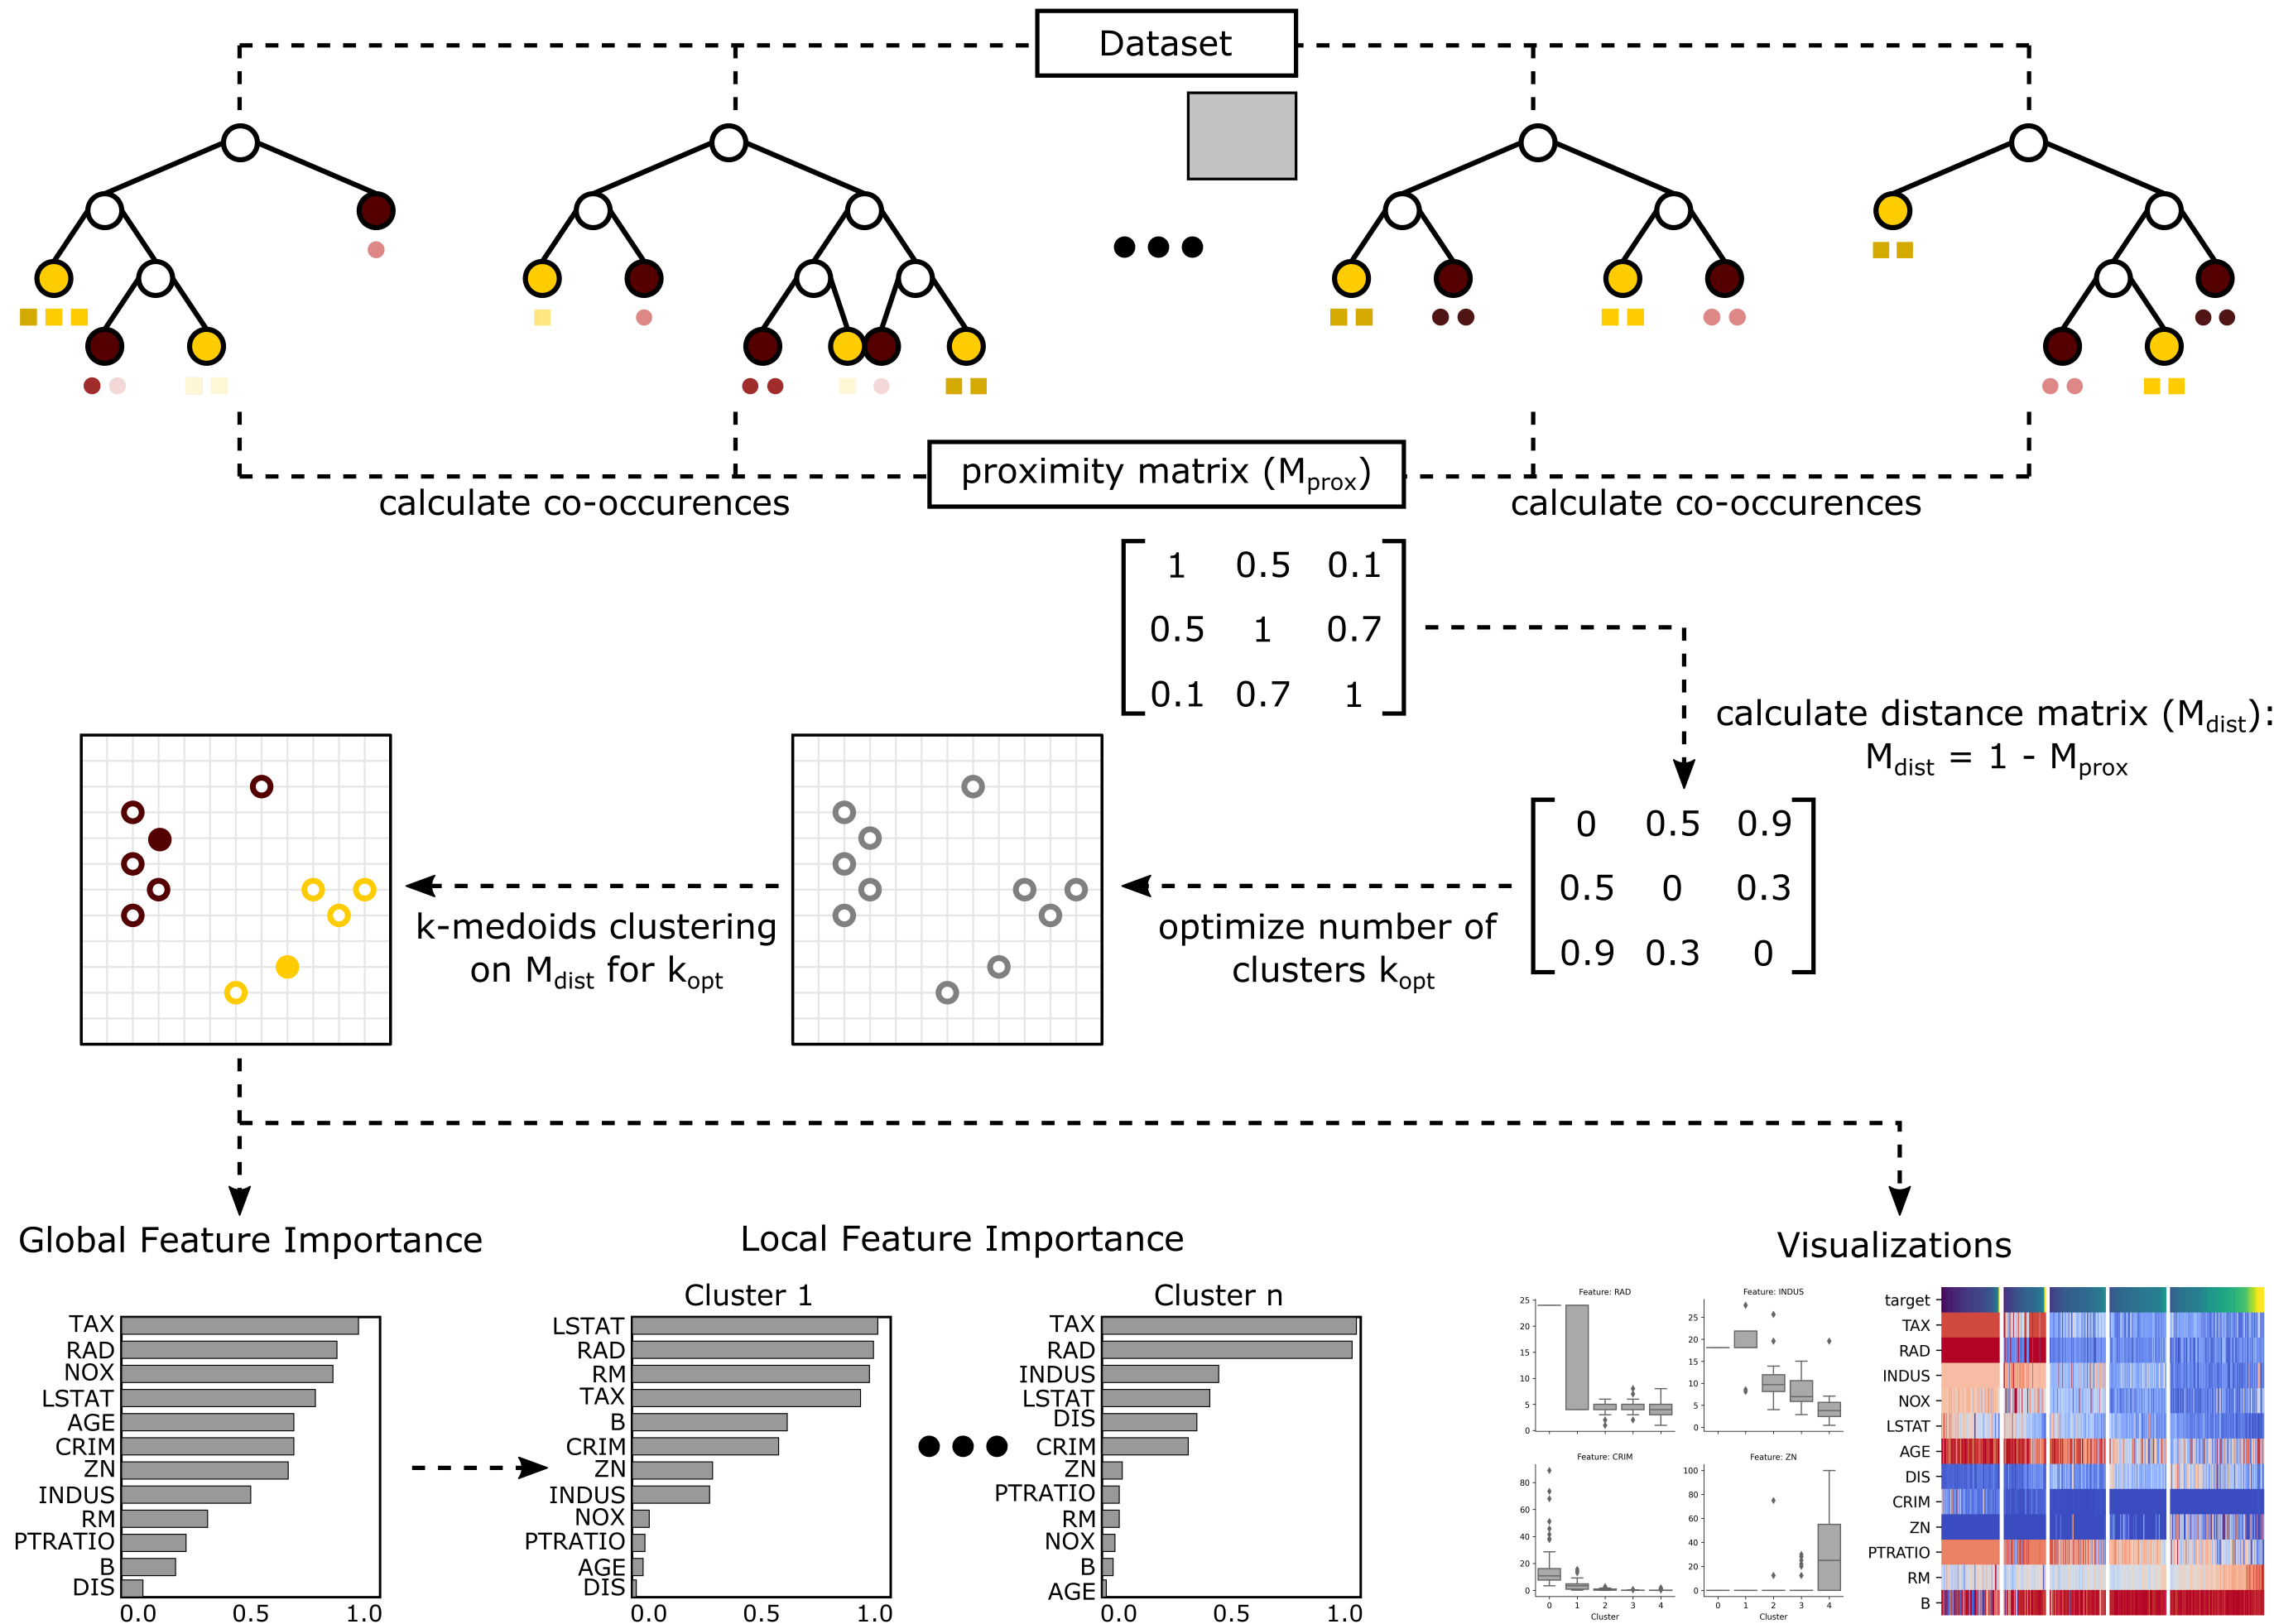
In the above example, the Forest-Guided Clustering would separate men and women into different subgroups, not because gender is a predictor of the disease, but because the Random Forest model considers different features for men and women, in order to determine the risk. The grouping of the dataset using Forest-Guided Clustering is thus more fine grained than the grouping of the Random Forest model. We do not only categorize the datapoints in a high and low risk group for the disease but into finer subgroups dependent on which factors are relevant for determining the risk.